While looking for internships, I thought of searching for an AI-based project at De Cronos Groep or even Brainjar specifically since multiple friends had recommended an internship with them. So, when my time came to apply for internships, I did not hesitate to contact them and was very excited when they responded for an interview.
The project
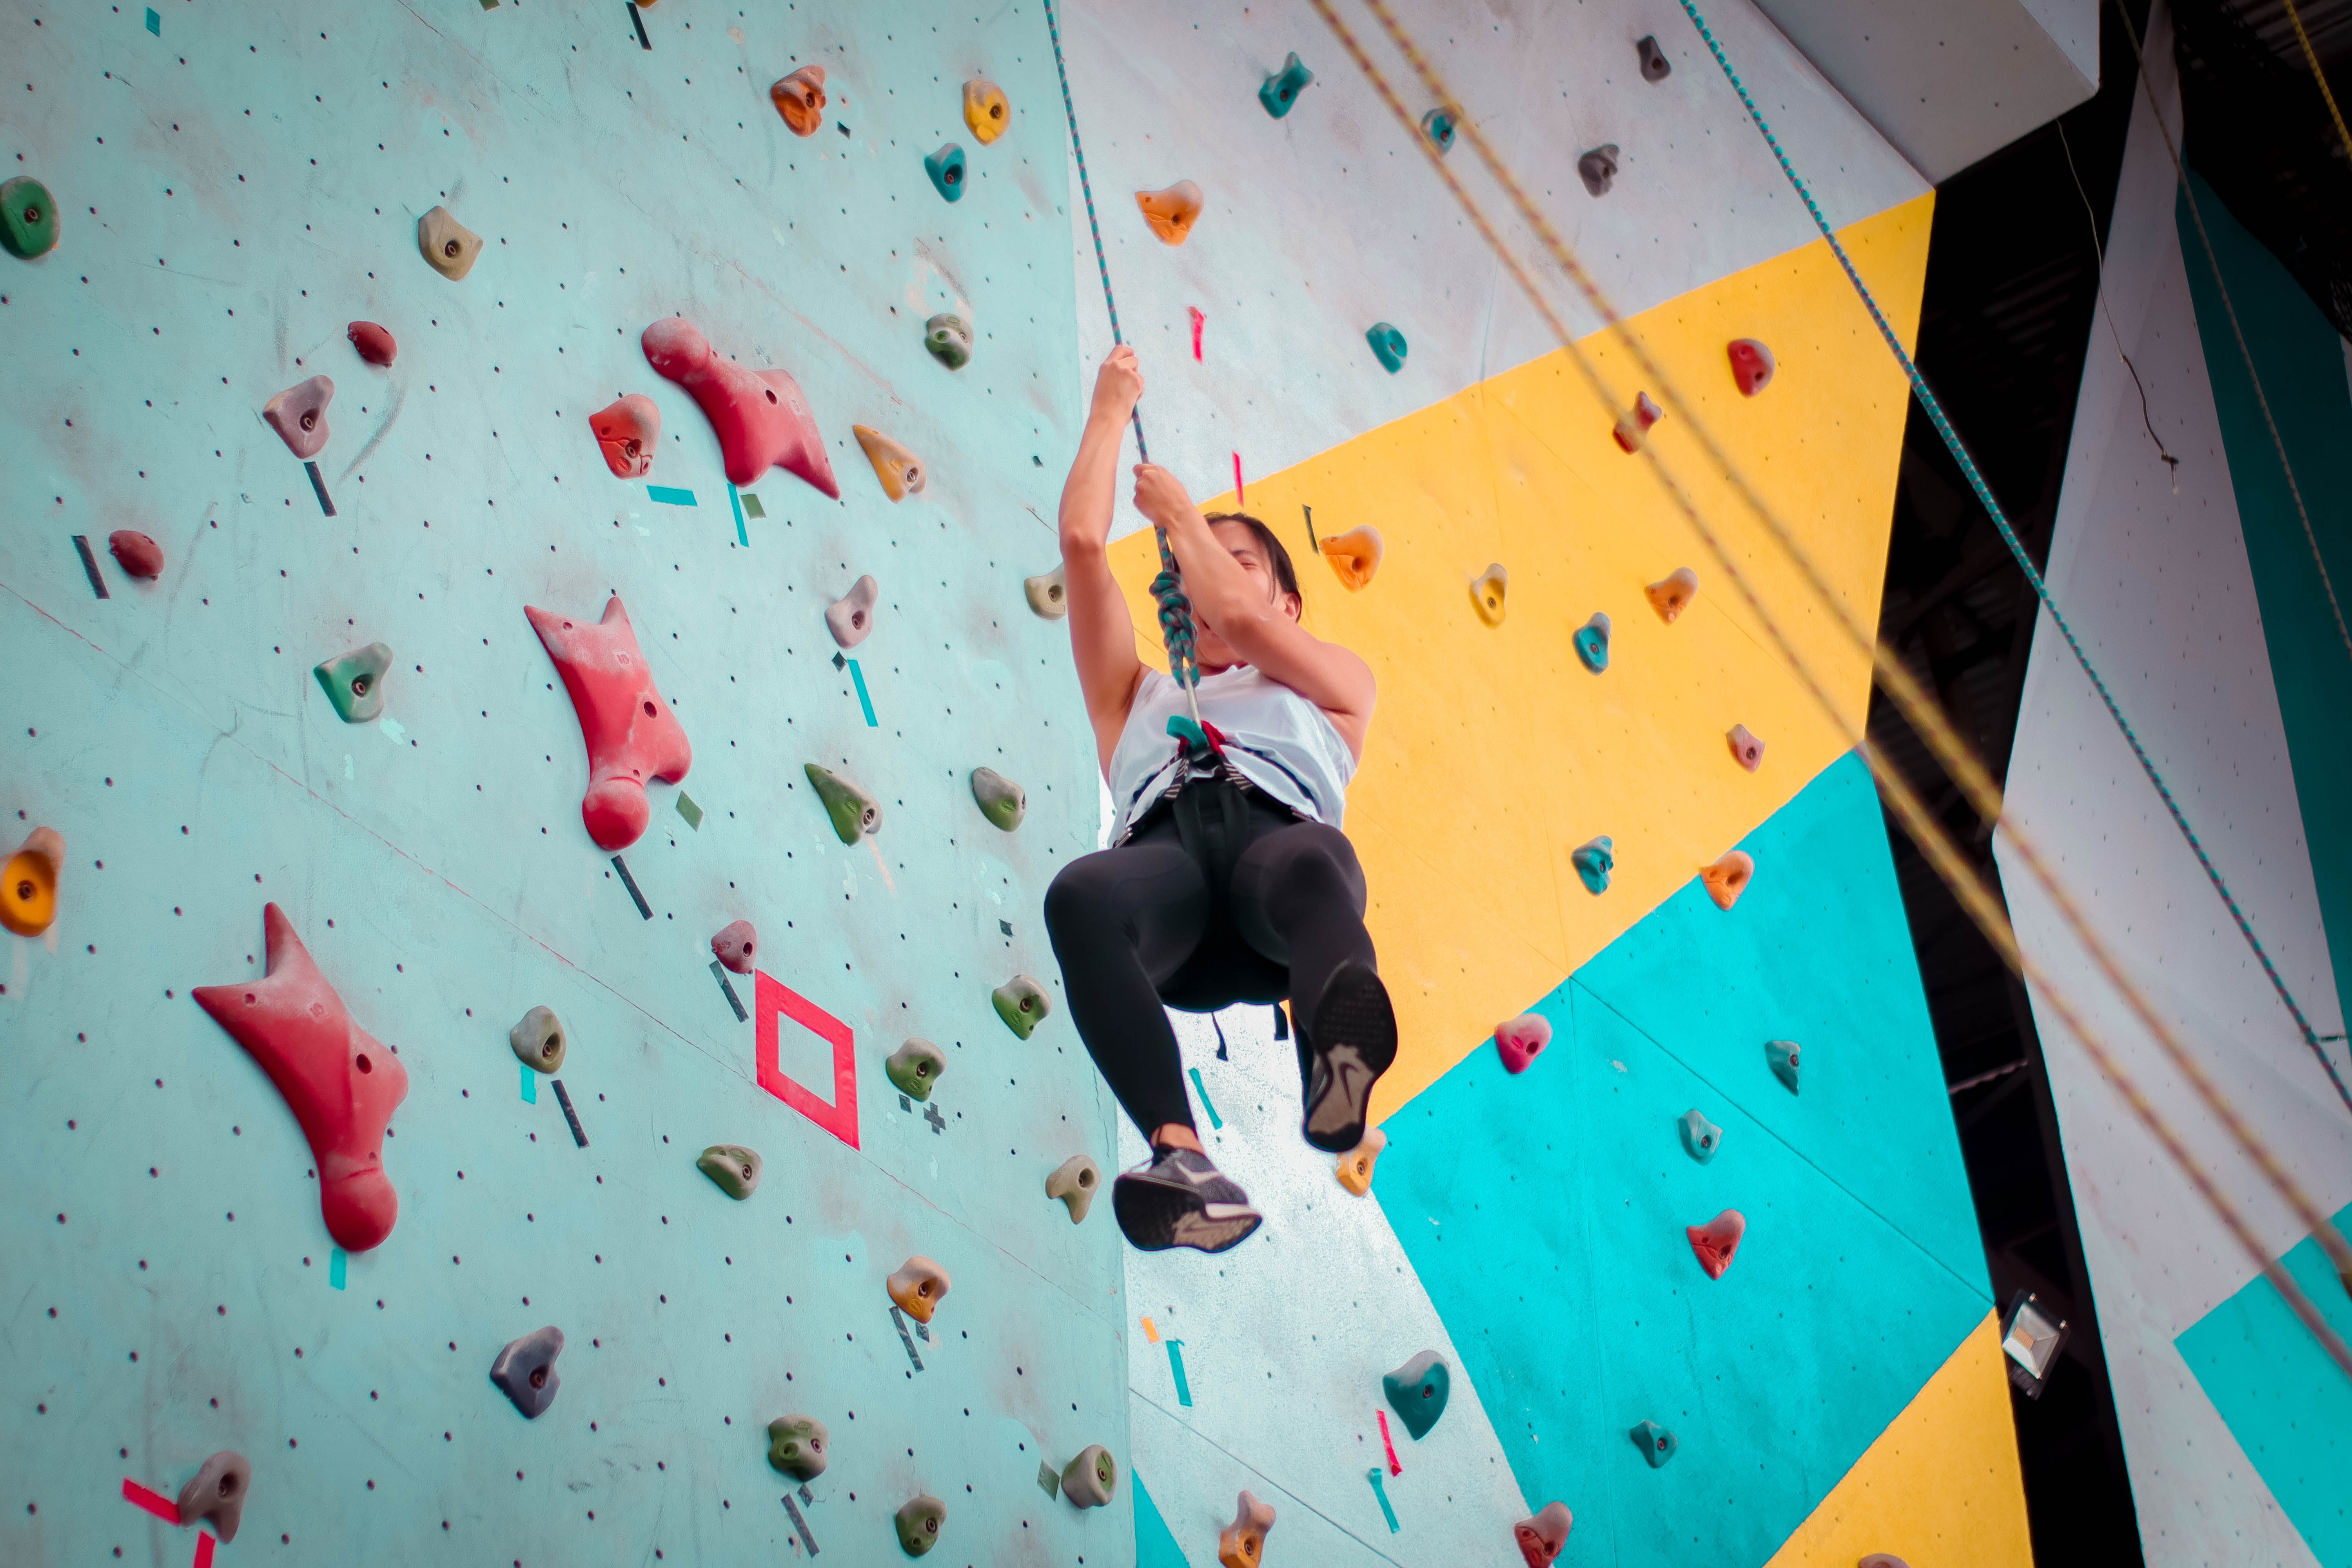
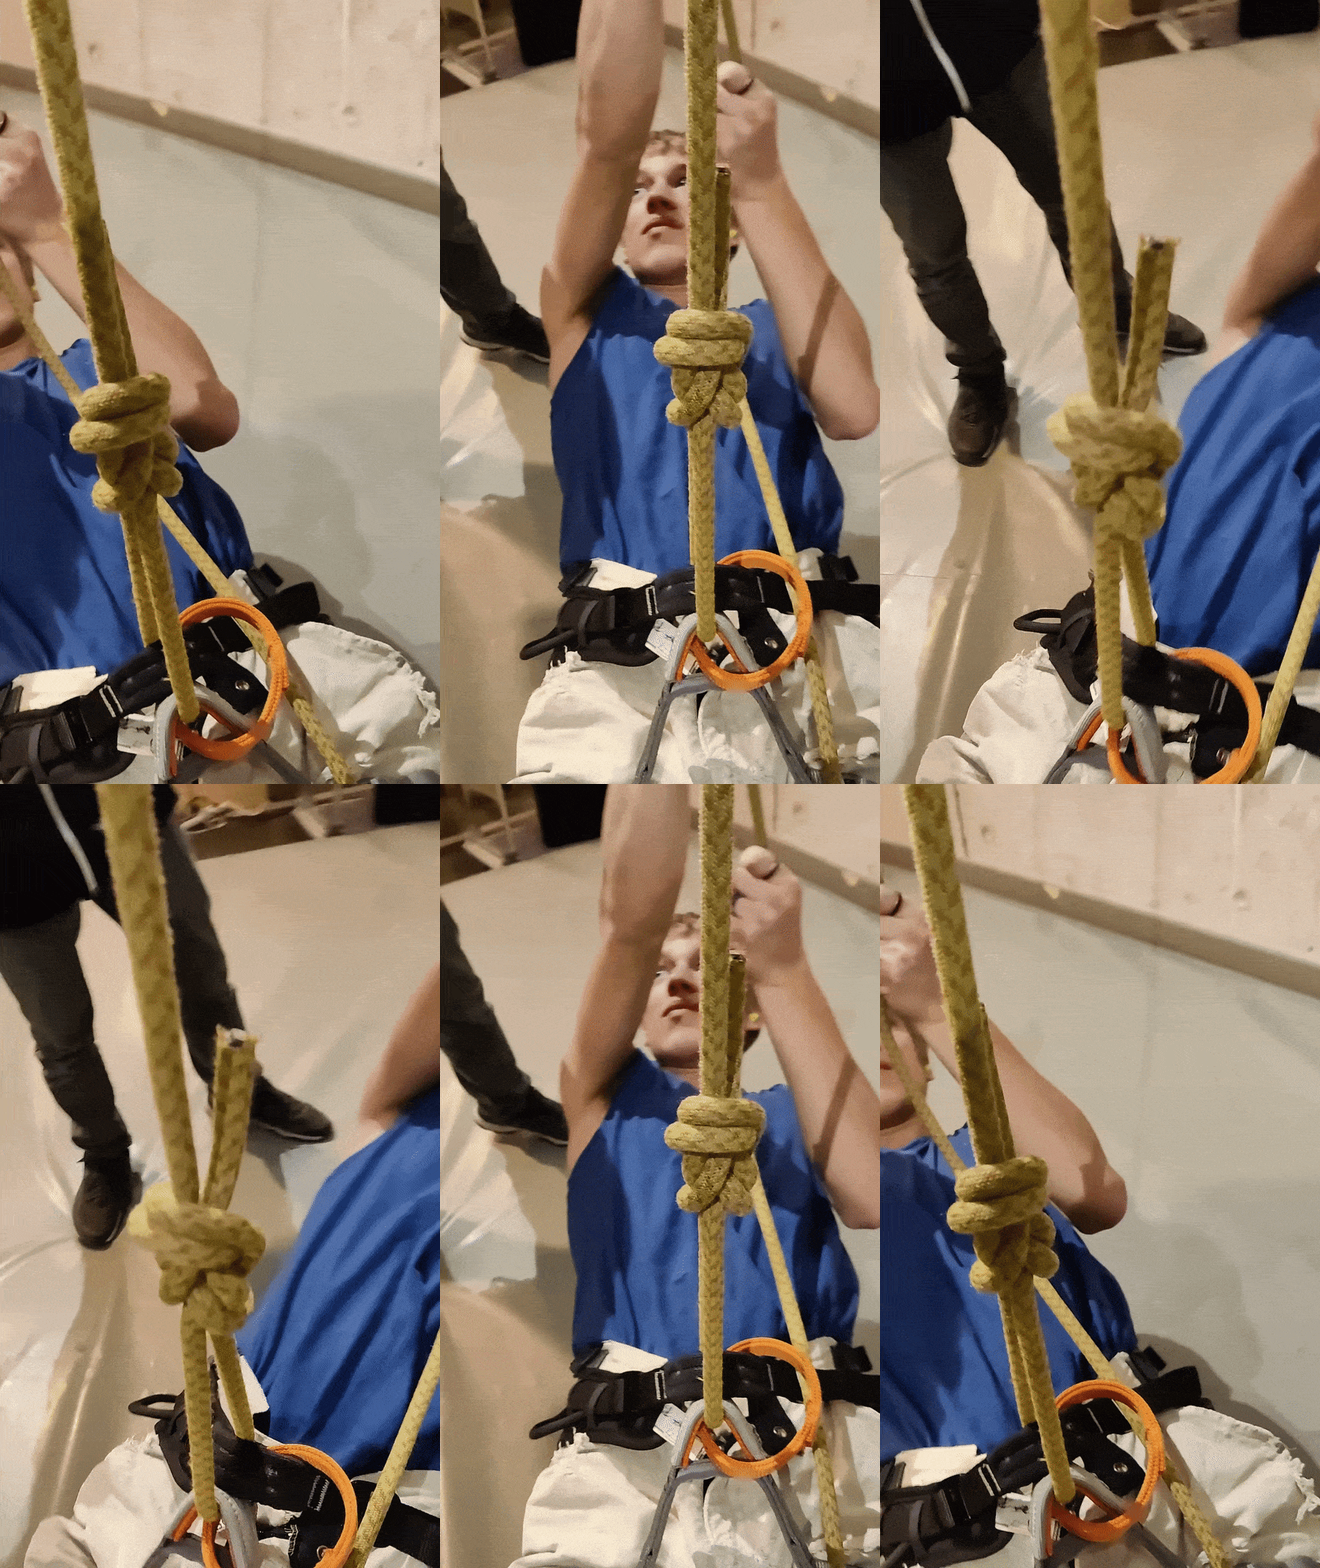
In short, my goal was to increase indoor top rope climbing safety by detecting incorrectly tied knots. But let's cover it in more detail!
We want to use computer vision to check the knot of the person climbing up the wall to see if it is safely tied. This should result in a real-time solution that people can use on top of the partner check to be extra safe.
In this case, accuracy is critical since we want to improve the safety of the climbers—a false positive results in a false sense of security which is the last thing we want.
I was incredibly excited about working with an actual client and not a simulation-like course in school. In addition, Stordeur is a climbing gym I actually visit as well.
The theory behind the partner check
“A moment of inattention, an instant of fatigue, excessive confidence: moments of absence in which one can quickly forget to make a knot in the end of the rope, lock a carabiner, finish the tie-in knot... oversights that often pass without notice until the day an accident happens... To help avoid this, one can adopt a simple habit, the PARTNER CHECK: a mutual checking between climber and belayer before starting each pitch," according to PETZL.
Getting set up
After getting set up with the work environment at Brainjar, the first step was to delve deep into the theoretical aspect of AI and Machine Learning. With the excellent guidance from my mentor to point me in the right direction, I was very efficiently getting my bearings in the field. I started by studying Deep Learning for Coders and testing out small computer vision examples to familiarize myself with the workflow.
Here’s a quick summary of the process:
- Identify the problem - In cooperation with client
- Define deliverables/criteria of success - Proof of concept to prove that it is achievable
- Find appropriate/existing computer vision techniques - Do not reinvent the wheel
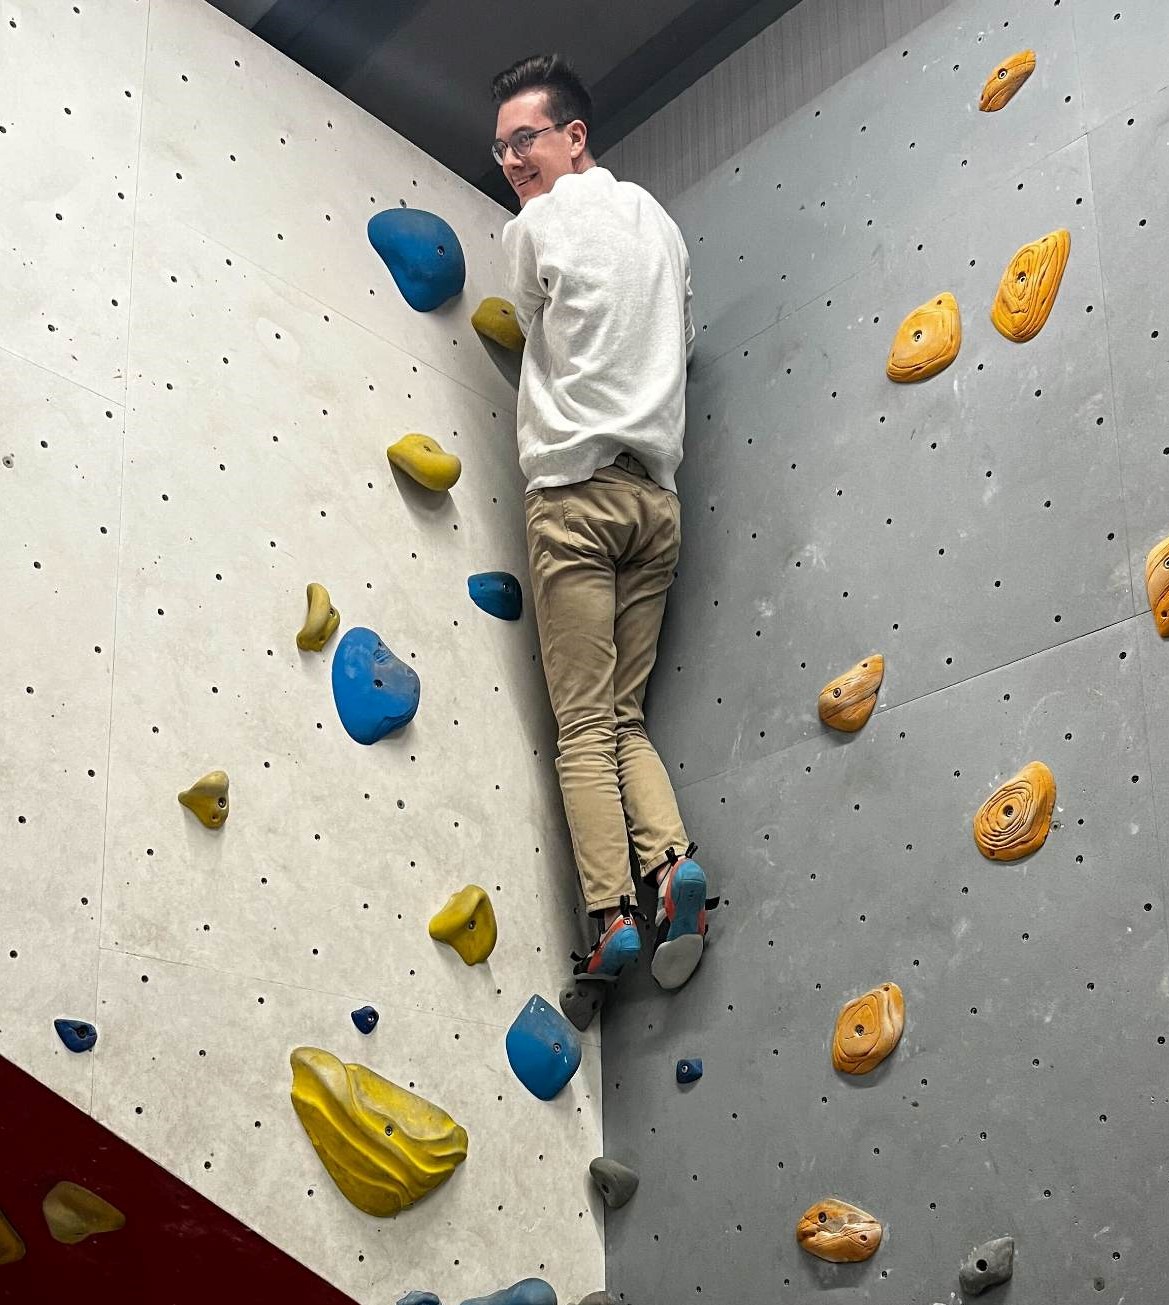
- Collect, evaluate and then label data - Go climbing
- Train and evaluate model - Tune parameters
- Deploy and test model - Test model in different implementations
- Iterate to solve issues and get better results from a better model - Look at results and assess the process
Technical implementation
Doing the research
First, I searched far and wide for existing implementations, research, papers, or frameworks that could provide a solution for this case. I compiled all my results and took the ones most likely to be viable options. Together with my mentor, I went over them, and we started brainstorming. In the end, we came up with some good options, and after narrowing them down, we ended up with two possible solutions.
Two-stage method
The first one was a two-stage solution. First, we use object detection and then classification on our video input:
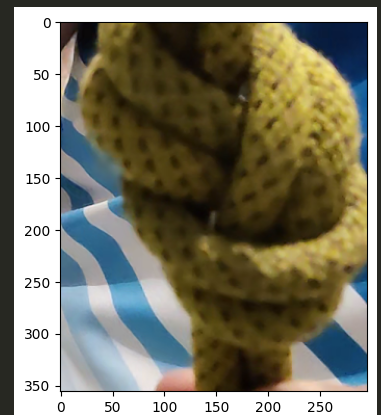
- Object detection with a FastAI fine-tuned pre-trained solution to crop our knots
- Classification model that takes cropped images of knots and classifies them as correct or not
- Then we use logic to decide if the video of the knot we just filmed was correct
- e.g.: the last 4 seconds’ worth of frames had to be more than 90% ‘correct’ knots.

One-stage method
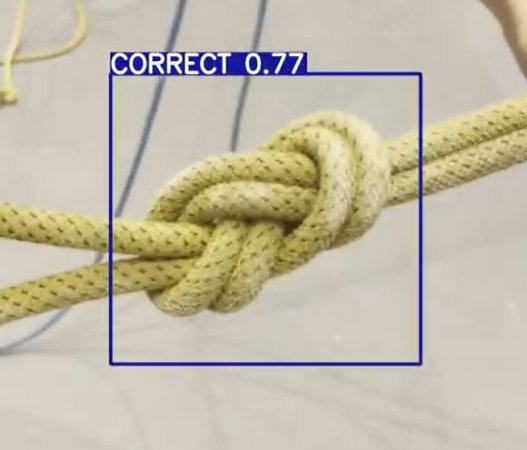
The other was a one-stage method that uses realtime object detection using YOLOV7
- It looks frame by frame at the incoming video and instantly detects a knot
- It detects it as ‘correct knot’ or ‘incorrect knot’
- Then again, we use logic to decide on e.g. the last 4 seconds determined using a queuing system
Training, testing, iterating
We hypothesized that the two-stage approach would be needed to ensure enough accuracy. Intuitively we figured that first detecting a general ‘knot-like’ object and then feeding only that data into a classification model would be best. But after testing both approaches, the one-stage realtime implementation functioned just as accurately—with added speed.
Frame creation
Eventually, I created a workflow using Jupyter Notebook and Python that easily converts and customizes our videos as data into frames. We decide how many frames we need for each video. Taking every frame from a 4-second 30fps video would already generate 120 images. As many of the frames would be almost the same, we would have way too much redundant data; I settled on a frame saved every half a second.
Annotation
Then I use prodigy to annotate my data. Prodigy is a handy annotation tool used primarily for textual machine learning, but it also provides enough computer vision features to cover my needs. The most impressive part of prodigy is the customizability it offers. If needed, it can be molded into your workflow and scaled to have your whole team help with annotation.
Annotations are stored in handy SQLite databases, so moving on with the data becomes very convenient. It could save the entire image in the database in a base64-encoded string, but that would take up a lot of space, so we only save references. You could even have a model in the loop to suggest annotations while working.
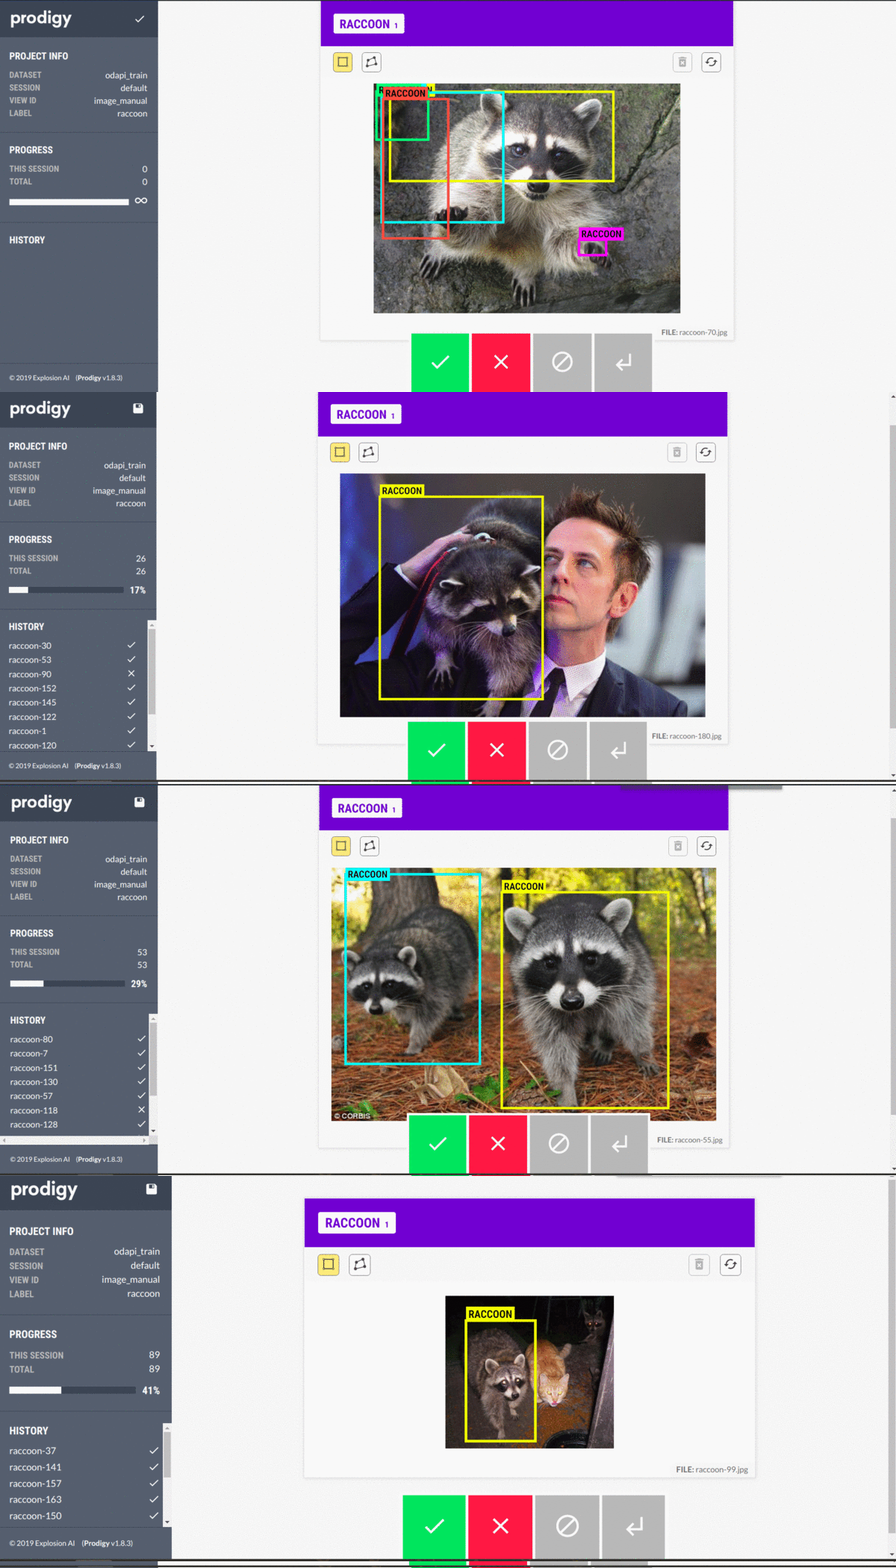
Then, we export our database to a JSONL (each line is a separate JSON object) format, which we can work with in Python.
.png)
We can then create the structure needed to train our YOLOV7 model, as it requires a specific folder structure and placement of the images.
Training
First, we augment some images by skewing, rotating, flipping, adding brightness and contrast, and so on. By doing this, we create a more diverse dataset and get more bang for our buck in terms of the data we have collected. The augmentation is done automatically while training and doesn't burden our disk space; a common practice in machine learning.
Moreover, we split our data into three sets, ensuring that the model does not overfit the training data and can generalize well to new data. Typically, the data is divided into 70% training, 20% validation, and 10% testing.
We then check the loss and f1 curve statistics to judge our model. We can also test it on unseen data that we kept away from the model during training to check the actual performance. Some of our used metrics:
- Loss: This metric measures the difference between predicted and actual output. A lower loss indicates a better model.
- Mean Average Precision (MAP): Measures the model's ability to detect and classify objects in an image accurately.
- Precision and Recall: These metrics measure how well the model detects true positives (correctly identified objects) and minimizes false positives (incorrectly identified objects)
- Intersection over Union (IoU): measures how much overlap is between the predicted bounding box and the ground-truth bounding box.
I found these metrics and techniques very interesting, as they give you a moment to think about the theory behind what the model is doing—the mathematics and algorithms at play. Since a good dose of experience is extremely handy here, I did not hesitate to have my mentor explain the what, why, and how of it all. 😉
Physical prototype and further steps
Eventually, I created a web-based demo that could show the workings of the trained model using an image, video, or webcam footage.
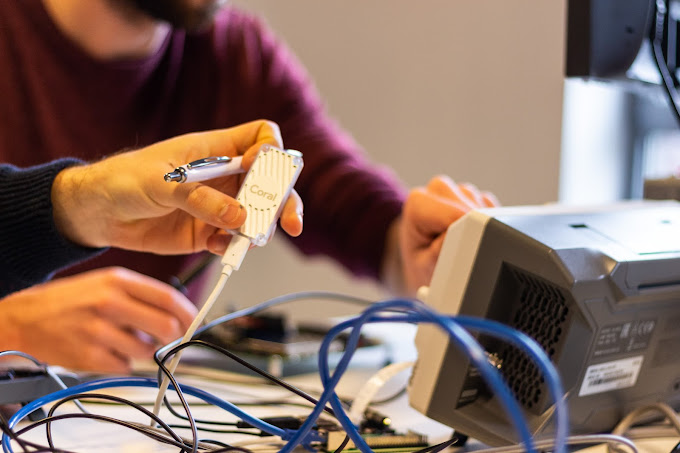
Per the client's request and since I was not just satisfied with learning about the software side of things, I delved into edge-based devices to develop a physical implementation of the solution. We tried working with a tiny specialized device, a Jetson Xavier, to get a working physical implementation. We laid the foundation for others to continue that line of testing and create a fully functional product.
If data is queen, then structure is king.
There is a functional workflow set up now to create a model, and with additional data, perhaps some extra care to collect data for specific edge cases, someone could take our work here further. Tuning the logic that comes after the inference could also drastically change the effectiveness of the implementation. Accuracy, thresholds, decision-making and especially the user experience (UI/UX) could be changed easily because of this.
Conclusion
Since I set out on this journey to provide a proof of concept of the desired model and implementation, I am pleased with the results. We proved that it is possible, showed a possible workflow leading to a working demo, and provided options for implementation for our client. My goal was to create that PoC while keeping a good structure intact to provide ample options for further development, and I think we succeeded at that.
A thank you is in order
I am incredibly grateful for the opportunity to work on such a fulfilling and enlightening project during my internship. I want to express my appreciation to Brainjar and my mentor, Arno, for providing me with the knowledge and experience that will be invaluable as I continue on my professional journey.